Bitcoin’s Most Reliable Signal Just Flashed—Next Stop: $170,000
Reason to trust
![]()
Strict editorial policy that focuses on accuracy, relevance, and impartiality
Created by industry experts and meticulously reviewed
The highest standards in reporting and publishing
Strict editorial policy that focuses on accuracy, relevance, and impartiality
Morbi pretium leo et nisl aliquam mollis. Quisque arcu lorem, ultricies quis pellentesque nec, ullamcorper eu odio.
The Hash Ribbon “buy” trigger – a signal embedded in Bitcoin’s network hashrate dynamics – has flashed again, and technical analyst Astronomer Zero believes it could pave the way to at least $170,000 per coin. A chart the analyst posted on X on 12 June overlays every prior weekly‐time-frame Hash Ribbon entry since 2020 on the BTC/USDT perpetual contract at Binance, illustrating why the signal is treated with almost talismanic respect by some quantitative traders.
Bitcoin Surge To $170,000 Imminent?
The graphic shows five earlier occurrences of the capitulation-to-recovery crossover embedded in the Hash Ribbon algorithm. Each is marked on the price pane by a cobalt-blue “Buy” dot directly beneath the weekly candles and linked to the ensuing rally by a violet measuring arrow.
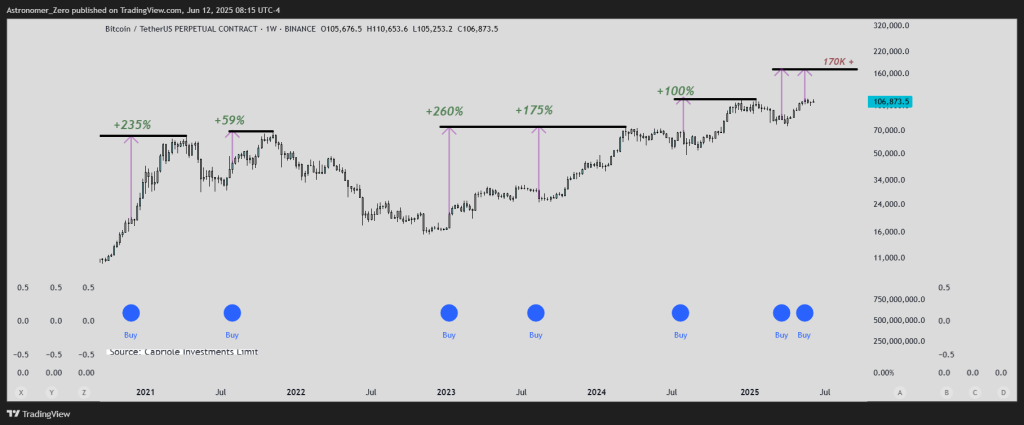
After the signal in late-2020, Bitcoin accelerated by 235% from the $18,000 consolidation floor to challenge the then-all-time-high zone just above $60,000 before any major pull-back unfolded. Mid-2021’s ribbon event proved more modest – roughly 59% from a $30,000 base into resistance near $48,000 – yet it still respected the rule that the market rewards the crossover with significant upside.
Related Reading
The next two signals, printed in late-2022 and early-2023, were far stronger: a 260% surge from the capitulation trough below $18,000, followed by a 175% leg in mid-2023 that carried price cleanly to the long-standing supply shelf in the $60,000 area. In mid-2024, the hash ribbon signal led to a 100% rally above $100,000.
Most recently, the ribbon crossed again three weeks ago, with Bitcoin quoted at roughly $105,000 on the weekly close. The analyst annotates current price at $106,873 and draws a fresh horizontal barrier at the $160,000–$165,000 band – the level that would align with the mean magnitude of earlier post-signal advances. Were the market merely to match the smallest historical percentage move (≈ 60%) from the present crossover, spot would extend to the $170,000 region indicated in crimson on the chart.
Related Reading
Hash Ribbon logic is mechanical. When the 30-day moving average of network hashrate climbs back above the 60-day average after a period of miner capitulation, on-chain observers read it as an all-clear that forced selling pressure has exhausted. In the past, that transition has coincided with aggressive spot accumulation visible on-chain and in derivatives positioning.
Sceptics will note that correlation is not causation and that a six-figure quote for Bitcoin already bakes in ETF inflows, a looming halving supply shock and a global liquidity cycle that could yet tighten. Still, Astronomer Zero’s chart underscores an objective fact: in the last half-decade the Hash Ribbon “buy” has never mis-fired. Whether history’s rhythm repeats or merely rhymes, traders are watching the $170,000 level marked on the chart as the next test of that record.
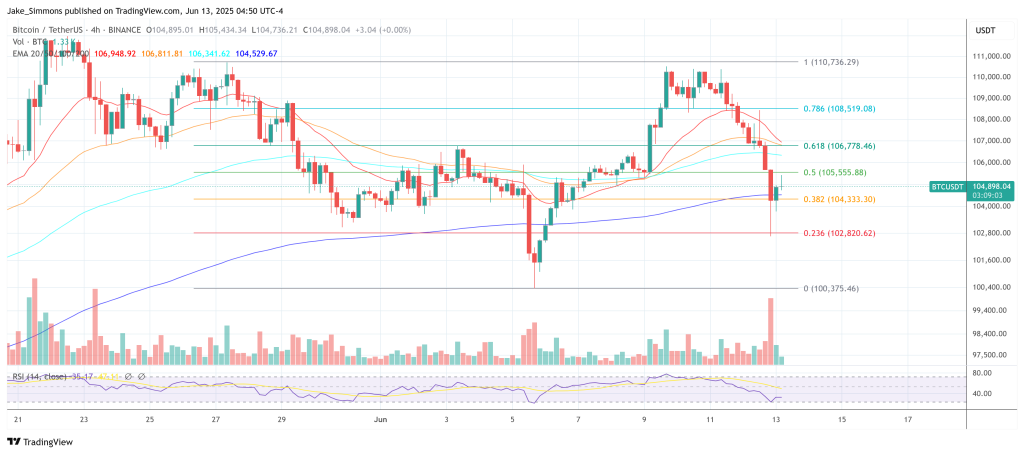
At press time, BTC was down 3.1% over the past 24 hours, trading at $104,898.
Featured image created with DALL.E, chart from TradingView.com