Bitcoin Weekly Drawdown Shrinks To 4.7% – Calm Before The Next Breakout?
Bitcoin is showing renewed strength above the $106,000 mark following a turbulent period driven by escalating Middle East tensions. Over the weekend, uncertainty spiked as geopolitical risks surged, but the announcement of a ceasefire between Iran and Israel has brought a degree of relief to global markets, crypto included. BTC has since reclaimed key levels, with bulls regaining short-term control.
According to data from CryptoQuant, the current market structure reflects a healthy and maturing bull cycle. Since the rally began in November 2022, Bitcoin has only experienced two major drawdowns exceeding 30%—one in August 2024 and another in April 2025. In both cases, prices quickly recovered and went on to set new all-time highs, signaling resilience and strong demand beneath the surface.
More importantly, all other corrections during this cycle have remained within a typical 10–20% range, functioning as short-term “shake-outs” rather than signs of weakness. At present, Bitcoin’s weekly SMA drawdown sits around -7%, while the overall drawdown is only -4.7%, suggesting the market is in a stable consolidation phase between $100,000 and $106,000. With volatility easing and buyers stepping in, BTC appears well-positioned for its next decisive move.
Bitcoin Consolidates As Market Maturity Reinforces Bullish Outlook
Bitcoin’s price action remains in focus after a sharp drop to $98,000 triggered market-wide concern. However, BTC quickly rebounded, climbing above the $105,000 level and stabilizing in a narrow consolidation range. While speculation around a potential double top continues to circulate, on-chain metrics suggest no structural breakdown. Market sentiment has leaned slightly bearish, but the underlying trend remains intact.
Top analyst Axel Adler highlighted a critical pattern: since the bull market began in November 2022, Bitcoin has only faced two significant corrections exceeding 30%—in August 2024 and April 2025. Both times, the asset swiftly recovered and moved on to set new highs. Outside of these episodes, price pullbacks have remained within the typical 10–20% range, functioning as healthy shake-outs rather than breakdowns. This consistency reflects a maturing market with stronger hands and more disciplined demand.
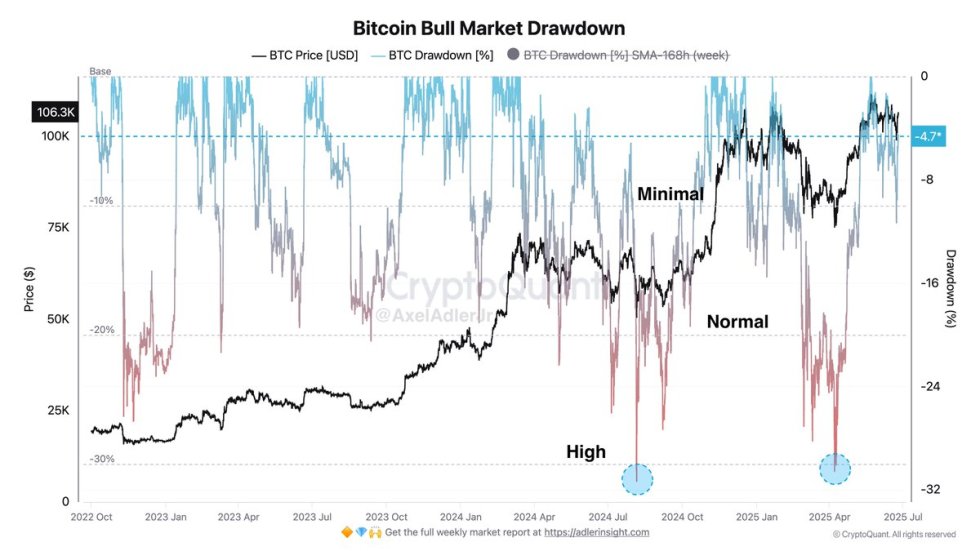
As of now, the weekly SMA drawdown sits around -7%, and the current drawdown is a modest -4.7%, reinforcing the idea of calm consolidation within the $100K to $106K range. The pattern of deep correction followed by accumulation and then a renewed push higher has defined this cycle. If this structure holds, Bitcoin could be gearing up for another leg toward new all-time highs. Confidence continues to grow that BTC’s path remains upward, driven by macro adoption, decreasing exchange liquidity, and the strengthening belief in Bitcoin as a long-term store of value.
BTC Approaches Key Resistance After Sharp Recovery
Bitcoin is currently trading at $106,622 on the 12-hour chart after rebounding strongly from the recent low of $98,000. The recovery, sparked by geopolitical de-escalation in the Middle East, pushed BTC above the critical $103,600 support level and into a renewed bullish structure. Price has now crossed above the 50 and 100-period moving averages ($105,410 and $105,309), a short-term positive signal suggesting growing momentum.
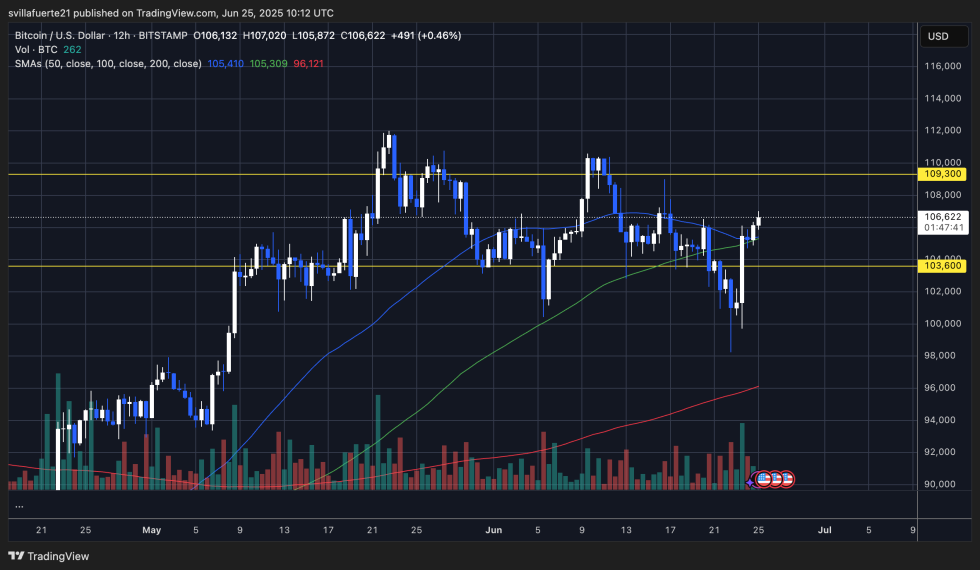
Volume also surged during the bounce, confirming strong buyer interest near the $100K mark. BTC now faces a decisive resistance zone around $109,300—the previous local top and a level where sellers have historically stepped in. If bulls manage to push through this zone with volume, it would likely trigger a breakout toward new highs.
However, rejection at this level could send Bitcoin back to retest the $103,600 support. The current consolidation range between $103K and $109K has served as a high-activity zone since early May, and a breakout in either direction would provide clearer market direction.
Featured image from Dall-E, chart from TradingView

Editorial Process for bitcoinist is centered on delivering thoroughly researched, accurate, and unbiased content. We uphold strict sourcing standards, and each page undergoes diligent review by our team of top technology experts and seasoned editors. This process ensures the integrity, relevance, and value of our content for our readers.