
Bitcoin Price Pattern Hints At $100,000 Target – Here’s Why
According to data from CoinMarketCap, Bitcoin (BTC) dipped by 1.12% in the past day drawing prices into the $103,000 region. Notably, this slight decline underscored another uneventful week in which Bitcoin failed to hold any convincing price breakout amidst an extended corrective phase. Interestingly, a popular market analyst with X username Titan of Crypto has weighed in Bitcoin’s latest rejection highlighting possible downside price targets.
Bitcoin Bulls Must Step In Now – Analyst
In an X post on June 20, the Titan of Crypto provides an in-depth analysis into a recent Bitcoin price rejection. The premier cryptocurrency initiated a price rally on June 20 to trade as high as $106,000 where it faced a stern rejection forcing a return below the $103,157.
According to Titan of Crypto’s analysis, Bitcoin’s price rejection at a Fair Value Gap (FVG) meaning price rose into an inefficiency zone but was unable to break through. For context, the FVG is a price imbalance or inefficiency on the chart where the market moved too quickly in one direction as seen on June 20, leaving behind a zone where little to no trading occurred.
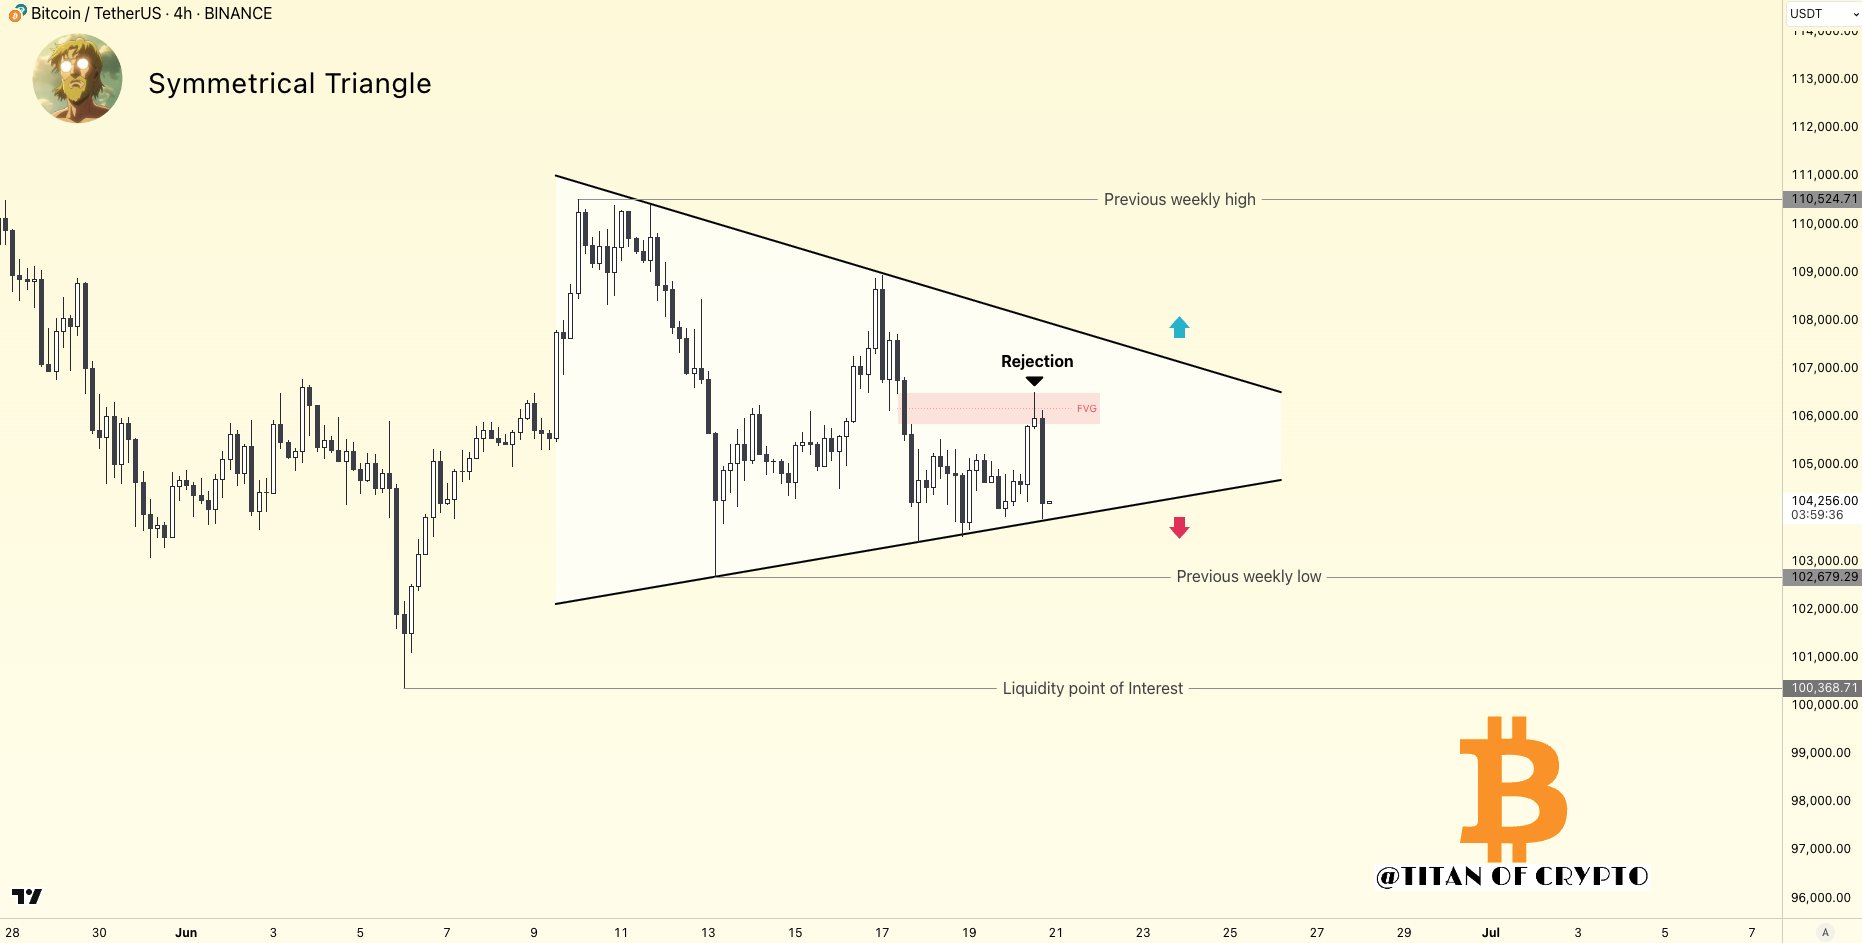
However, the FVG lies within a bigger symmetrical triangle – a common chart pattern that signals a period of consolidation before a major price move. As seen in the chart above, it is formed by two converging trendlines, narrowing structure suggests growing pressure, often leading to a breakout or breakdown as the market seeks direction.
Based on recent developments, BTC has retested and now broken through through the lower boundary of the symmetrical triangle indicating a potential for further downside. According to Titan of Crypto, possible price targets for Bitcoin in this event include the previous weekly low at $102, 679, failure of which to act as a strong support zone would force prices to around the psychological $100,000 zone.
Bitcoin Market Overview
In other developments, blockchain analytics firm Sentora reports that Bitcoin networks fees grew by 105.8% on the weekly scale indicating a surge in transaction numbers and user engagement. Meanwhile, there was an notable exchange outflow of $2.06 billion suggesting a long-term market confidence as investors move their holdings to their private decentralized wallet.
As earlier stated, BTC is trading at $103,402 with losses of 1.88% and 7.02% on the weekly and monthly chat. Meanwhile, the daily asset trading volume is up by 38.31% and valued at $50.14.
BTC trading at $103,882 on the daily chart. Chart: Tradingview.
Featured image from Pexels, chart from Tradingview.

Editorial Process for bitcoinist is centered on delivering thoroughly researched, accurate, and unbiased content. We uphold strict sourcing standards, and each page undergoes diligent review by our team of top technology experts and seasoned editors. This process ensures the integrity, relevance, and value of our content for our readers.