
Bitcoin Hashrate Plunges 11%—Are Miners Turning Bearish?
After setting a new all-time high (ATH) earlier in the month, the Bitcoin Hashrate has seen a crash. Here’s what this could mean for the asset.
7-Day Average Bitcoin Hashrate Has Plummeted Since The Record
The “Hashrate” refers to an indicator that measures the total amount of computing power that miners have connected to the Bitcoin network for the purpose of mining. The metric’s value is measured in terms of hashes per second (H/s), or the more practical exahashes per second (EH/s).
When the value of this indicator rises, it means the miners are adding more power to the blockchain. Such a trend suggests BTC mining is looking profitable to these chain validators.
On the other hand, the metric going down can imply some of the cohort’s members are coming under pressure, so they have decided to scale back on their facilities.
Now, here is a chart from Blockchain.com that shows the trend in the 7-day average of the Bitcoin Hashrate over the past year:
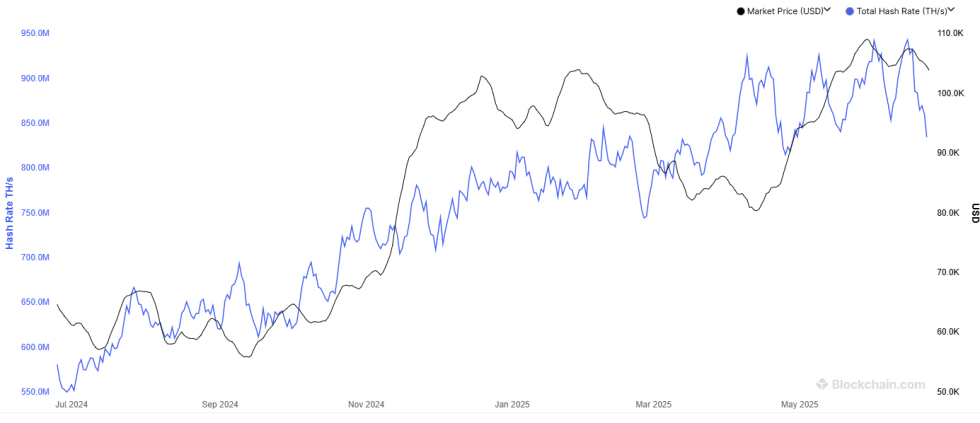
Looks like the value of the metric has sharply gone down in recent days | Source: Blockchain.com
As displayed in the above graph, the 7-day average Bitcoin Hashrate saw a rapid increase to a new ATH of about 943.6 EH/s on June 15th. Since this peak, however, the indicator has witnessed a sharp reversal. Today, the miners’ computing power amounts to 834.8 EH/s, more than 11% down compared to the record.
Considering the fast decline, it’s possible that miners are feeling financial pressure. And indeed, according to an on-chain model, this group can currently be classified as extremely underpaid.
The miners may also be feeling bearish about the cryptocurrency, considering all the geopolitical events that have occurred since the high in the Hashrate, feeding into market uncertainty.
Miners depend on growth in the asset’s price to improve their margins, so their behavior is often linked to the trend in the coin itself. Sometimes, miners do expand or decommission operations anticipating future action, though these bets don’t always pay off.
From the chart, it’s visible that this isn’t the first time this year that the indicator has seen a quick top followed by a rapid decline. Since April, the metric has now displayed this pattern four times, with the peak setting a slightly bigger record in each instance.
Considering this trend, it’s possible that the latest drawdown may also just be similar, and the 7-day average Hashrate would rebound before long. That said, in the scenario that the decline does elongate beyond the current point, which is already close to the low of the metric’s recent range, then it could potentially signal that a real shift may be taking place among the miners.
Generally, though, miners changing the Hashrate doesn’t impact the Bitcoin price, at least not directly. What a decline can signal, however, is distress among the group, which can force them into selling.
BTC Price
At the time of writing, Bitcoin is floating around $105,100, down 0.3% in the last seven days.
The trend in the BTC price over the past five days | Source: BTCUSDT on TradingView
Featured image from Dall-E, Blockchain.com, chart from TradingView.com

Editorial Process for bitcoinist is centered on delivering thoroughly researched, accurate, and unbiased content. We uphold strict sourcing standards, and each page undergoes diligent review by our team of top technology experts and seasoned editors. This process ensures the integrity, relevance, and value of our content for our readers.