Bitcoin Flashes Rare Signal That Could Trigger Drop Below $40,000, Analyst Warns
Bitcoin (BTC) recently closed its June monthly candle above $100,000, raising hopes among bulls for continued upside throughout the summer. However, the digital asset has now flashed a rare signal that warns of a significant price pullback in the coming months.
Bitcoin Flashes Rare Bearish Signal
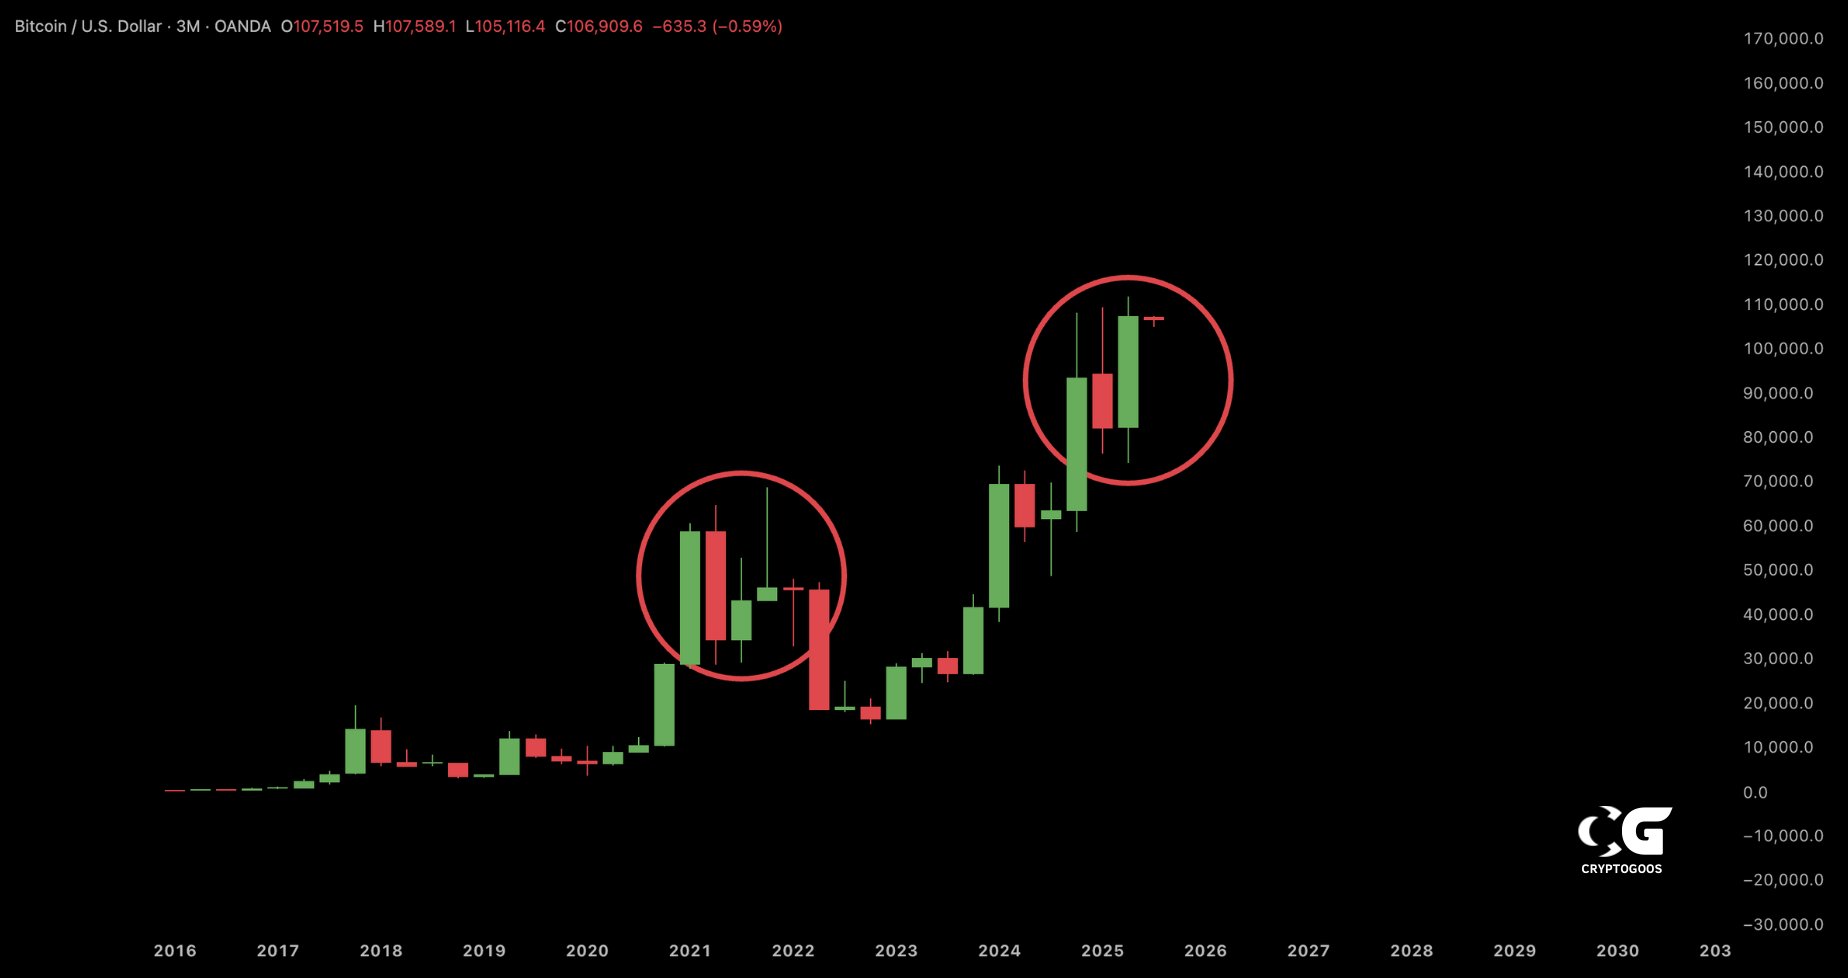
According to a recent X post by seasoned crypto analyst Ali Martinez, Bitcoin has triggered a Tom Demark (TD) Sequential sell-signal on the quarterly chart. Martinez noted that this is a rare and historically reliable warning that has often preceded major drawdowns for the cryptocurrency.
For the uninitiated, a quarterly TD Sequential sell-signal is a rare technical indicator that appears after multiple consecutive bullish quarterly candles, signaling long-term trend exhaustion. It suggests that Bitcoin may face a significant correction after a prolonged uptrend.
In 2015, its appearance was followed by a 75% decline in BTC, while in 2018, a similar signal preceded an 85% crash. Martinez cautioned that if the current signal plays out similarly, Bitcoin could fall as low as $40,000 – a potential 64% drop from current levels.
However, not all analysts share this bearish outlook. Fellow crypto analyst CryptoGoos interpreted Bitcoin’s quarterly close as bullish. He disputed comparisons with the 2021 double-top pattern and suggested that market structure remains strong.
BTC Looking Ready For New High?
Despite the bearish TD Sequential sell-signal, several analysts remain confident that a new all-time high (ATH) is on the horizon. Analyst Jelle pointed out that BTC has broken out and successfully re-tested a 3-day bullish pennant, making it look “ripe for liftoff.”

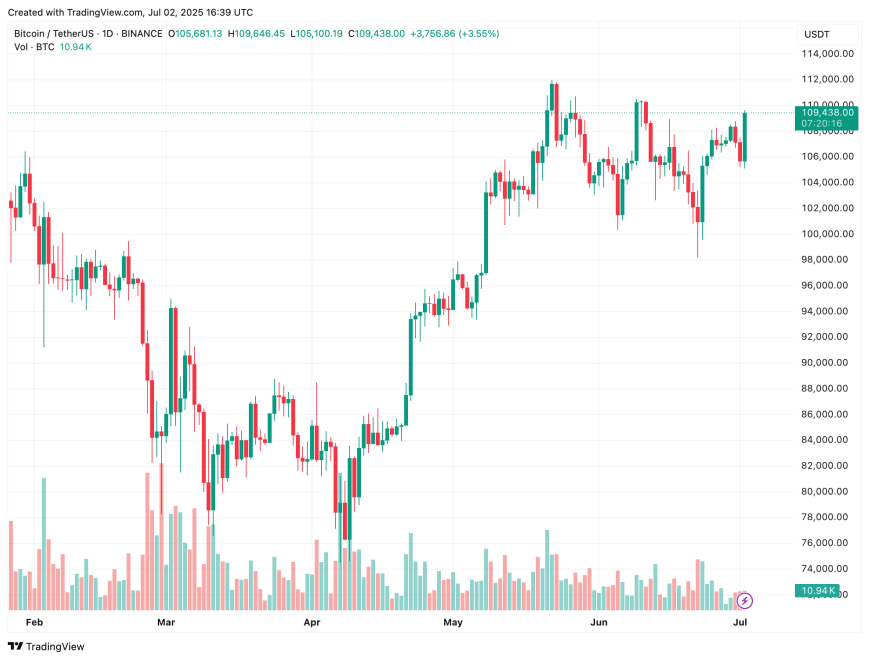
In another post, Jelle noted that if BTC decisively breaks above $110,000, its next target could be $130,000. For reference, BTC’s current ATH is $111,814, recorded on May 22.
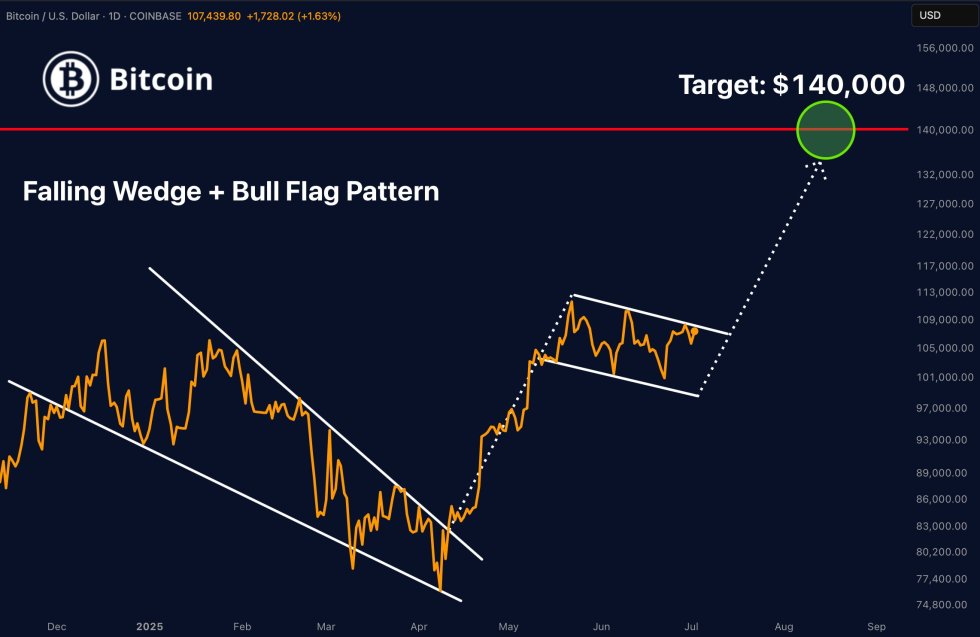
Meanwhile, Merlijn The Trader highlighted a bullish technical setup on BTC’s daily chart. He pointed to a breakout from a falling wedge, followed by the formation of a bull flag – two strong continuation patterns. He stated:
Two of the strongest continuation patterns back to back. $140K is not hopium. It’s the projection. Strong hands are positioning now. Bitcoin doesn’t wait. The breakout is inevitable.
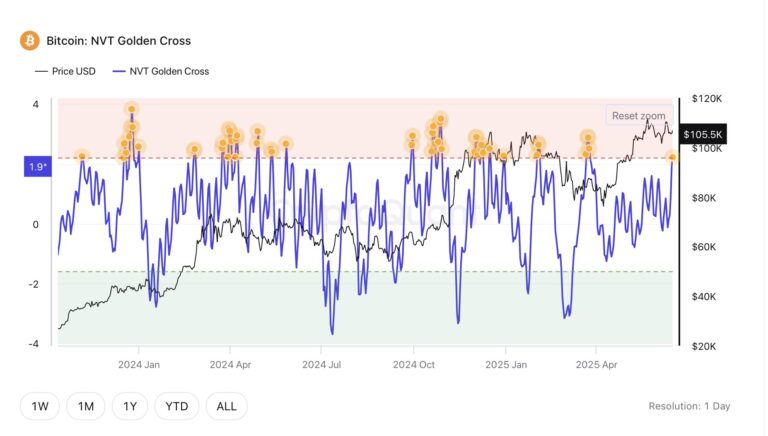
Additionally, Bitcoin’s weekly RSI continues to move toward the upper trendline – a pattern that has historically coincided with BTC reaching new highs. At press time, BTC trades at $109,438, up 2.9% in the past 24 hours.
Featured image from Unsplash.com, charts from X and TradingView.com

Editorial Process for bitcoinist is centered on delivering thoroughly researched, accurate, and unbiased content. We uphold strict sourcing standards, and each page undergoes diligent review by our team of top technology experts and seasoned editors. This process ensures the integrity, relevance, and value of our content for our readers.